A graph database is defined as a specialized, single-purpose platform for creating and manipulating graphs. Graphs contain nodes, edges, and properties, all of which are used to represent and store data in a way that relational databases are not equipped to do.
Graph analytics is another commonly used term, and it refers specifically to the process of analyzing data in a graph format using data points as nodes and relationships as edges. Graph analytics requires a database that can support graph formats; this could be a dedicated graph database, or a converged database that supports multiple data models, including graph.Learn how to use graph with a step-by-step workshop
Graph database types
There are two popular models of graph databases: property graphs and RDF graphs. The property graph focuses on analytics and querying, while the RDF graph emphasizes data integration. Both types of graphs consist of a collection of points (vertices) and the connections between those points (edges). But there are differences as well.
Property graphs
Property graphs are used to model relationships among data, and they enable query and data analytics based on these relationships. A property graph has vertices that can contain detailed information about a subject, and edges that denote the relationship between the vertices. The vertices and edges can have attributes, called properties, with which they are associated.
In this example, a set of colleagues and their relationships are represented as a property graph.
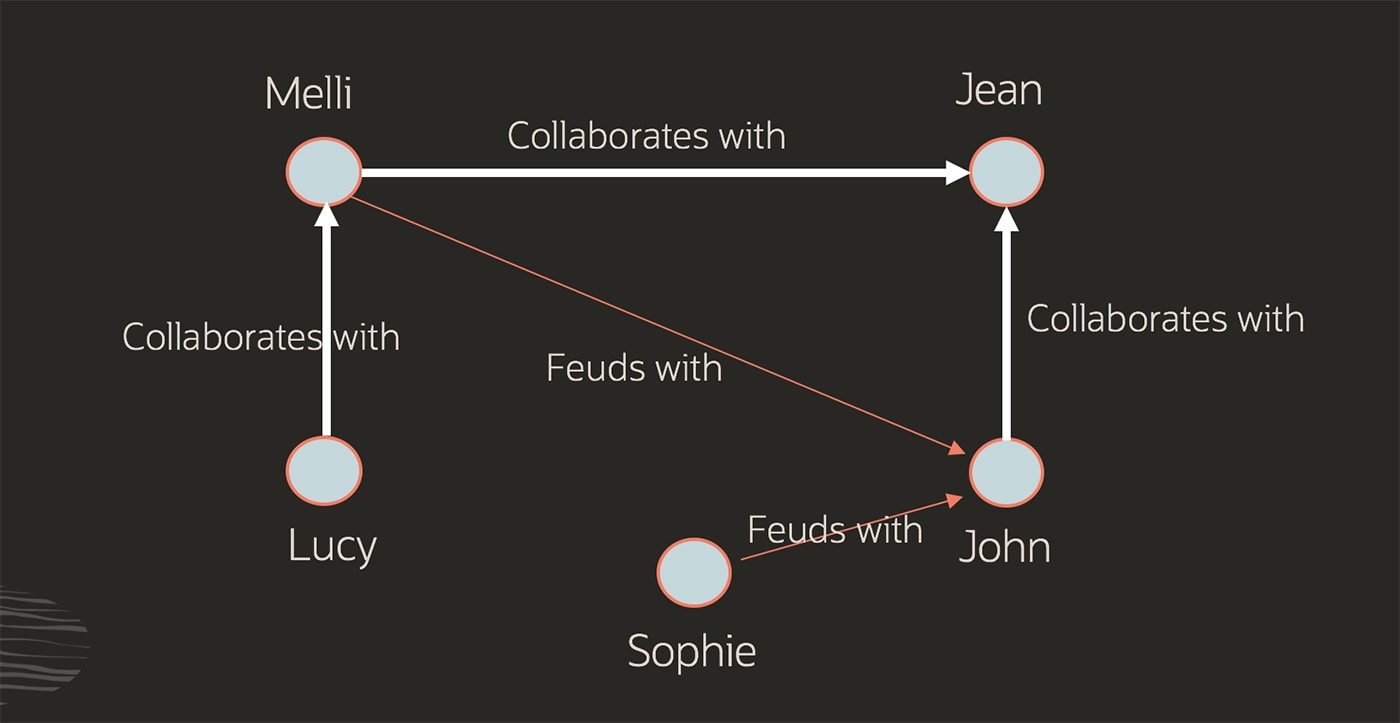
Because they are so versatile, property graphs are used in a broad range of industries and sectors, such as finance, manufacturing, public safety, retail, and many others.
RDF graphs
RDF graphs (RDF stands for Resource Description Framework) conform to a set of W3C (Worldwide Web Consortium) standards designed to represent statements and are best for representing complex metadata and master data. They are often used for linked data, data integration, and knowledge graphs. They can represent complex concepts in a domain, or provide rich semantics and inferencing on data.
In the RDF model a statement is represented by three elements: two vertices connected by an edge reflecting the subject, predicate and object of a sentence—this is known as an RDF triple. Every vertex and edge is identified by a unique URI, or Unique Resource Identifier. The RDF model provides a way to publish data in a standard format with well-defined semantics, enabling information exchange. Government statistics agencies, pharmaceutical companies, and healthcare organizations have adopted RDF graphs widely.
How graphs and graph databases work
Graphs and graph databases provide graph models to represent relationships in data. They allow users to perform “traversal queries” based on connections and apply graph algorithms to find patterns, paths, communities, influencers, single points of failure, and other relationships, which enable more efficient analysis at scale against massive amounts of data. The power of graphs is in analytics, the insights they provide, and their ability to link disparate data sources.
When it comes to analyzing graphs, algorithms explore the paths and distance between the vertices, the importance of the vertices, and clustering of the vertices. For example, to determine importance algorithms will often look at incoming edges, importance of neighboring vertices, and other indicators.
Graph algorithms—operations specifically designed to analyze relationships and behaviors among data in graphs—make it possible to understand things that are difficult to see with other methods. When it comes to analyzing graphs, algorithms explore the paths and distance between the vertices, the importance of the vertices, and clustering of the vertices. The algorithms will often look at incoming edges, importance of neighboring vertices, and other indicators to help determine importance. For example, graph algorithms can identify what individual or item is most connected to others in social networks or business processes. The algorithms can identify communities, anomalies, common patterns, and paths that connect individuals or related transactions.
Because graph databases explicitly store relationships, queries and algorithms utilizing the connectivity between vertices can be run in sub-seconds rather than hours or days. Users don’t need to execute countless joins and the data can more easily be used for analysis and machine learning to discover more about the world around us.
Advantages of graph databases
The graph format provides a more flexible platform for finding distant connections or analyzing data based on things like strength or quality of relationship. Graphs let you explore and discover connections and patterns in social networks, IoT, big data, data warehouses, and also complex transaction data for multiple business use cases including fraud detection in banking, discovering connections in social networks, and customer 360. Today, graph databases are increasingly being used as a part of data science as a way to make connections in relationships clearer.
Because graph databases explicitly store the relationships, queries and algorithms utilizing the connectivity between vertices can be run in subseconds rather than hours or days. Users don’t need to execute countless joins and the data can more easily be used for analysis and machine learning to discover more about the world around us.
Graph databases are an extremely flexible, extremely powerful tool. Because of the graph format, complex relationships can be determined for deeper insights with much less effort. Graph databases generally run queries in languages such as Property Graph Query Language (PGQL). The example below shows the same query in PGQL and SQL.
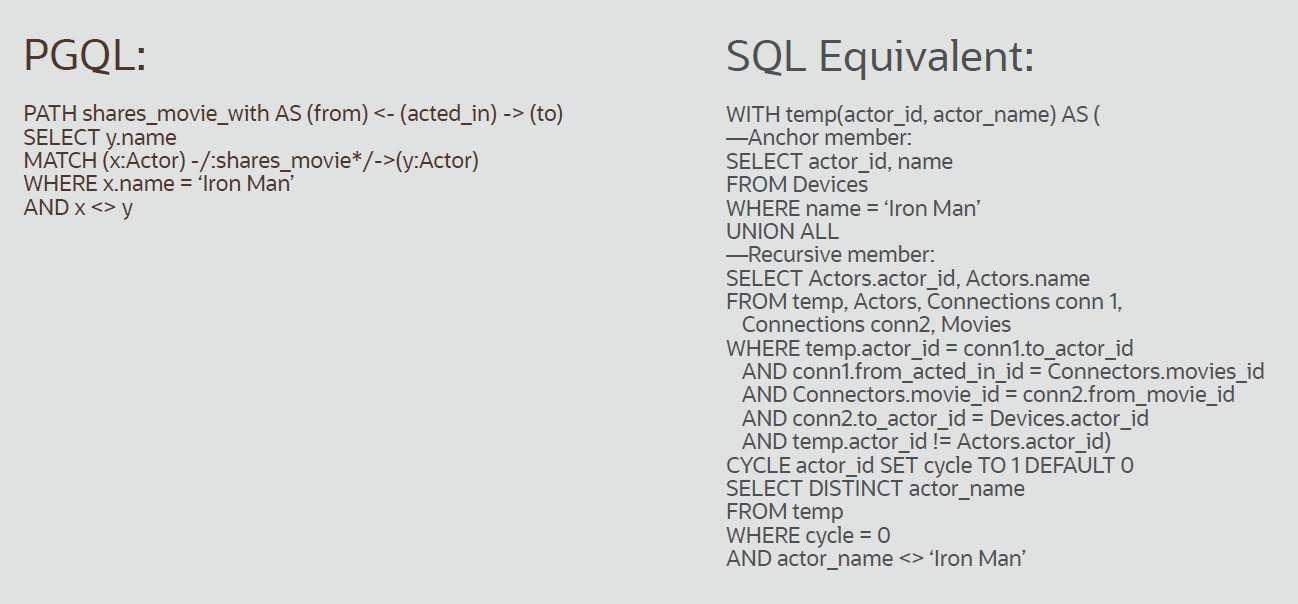
As seen in the above example, the PGQL code is simpler and much more efficient. Because graphs emphasize relationships between data, they are ideal for several different types of analyses. In particular, graph databases excel at:
- Finding the shortest path between two nodes
- Determining the nodes that create the most activity/influence
- Analyzing connectivity to identify the weakest points of a network
- Analyzing the state of the network or community based on connection distance/density in a group
More info: What is a Graph Database? | Oracle